First Look at the 2020 Census Data
What we can learn from the Eastern Shore of Maryland
I would have some deeper analysis for yinz, but the situation in Afghanistan has put me into a funk. I am overwhelmingly saddened by the complete unraveling of the past 20 years of American policy and our total inability to get the people out of Kabul that we need to. Operation Frequent Wind and its sisters evacuated over 50,000 people. I am seeing that the US might only evacuate 30,000 people and leave hundreds of thousands of people who helped the country over the last 20 years to fend for themselves. This whole situation makes me wonder why people will ever help us again. The US should bring every person who ever helped us and their family to the US.
Also, I am really tired of politicians who have had a big talk about “end forever wars” through any means necessary but now are unhappy about the chaos in Kabul. I continue to agree with my tweet from Sunday:

But none of you are here for my foreign policy takes, so onto the main event.
The census bureau released the first 2020 census numbers on Thursday, 12 August 2021 for states to start their redistricting efforts. This data was in a legacy file format that was pipe separated and spread over three files. After banging my head against the wall trying to make heads and tails of the data, Matt Castillon sent me a new R package, PL94171, that turns the data into a usable file format. Unfortunately, I have never used R before this project, oops.
After a few evenings and a Saturday of hacking away at the data, I came up with the following code to get me the shapefiles and census data.1 I ran into a number of snags along the way. I knew what I wanted to do, but I ran into behavior that I was not used to coming from Python and C++. Also, the complex script that downloaded all of the states I wanted to look at in one go was mixing and matching states and years for some reason. But, this script did everything I wanted to do.
| library(PL94171) | |
| library(tigris) | |
| library(rgdal) | |
| library(dplyr) | |
| # Simplifed Rename function | |
| renameColums <- function(dat){ | |
| a <- rename_with(dat, ~gsub(".x", "_2020", .x)) | |
| a <- rename_with(a, ~gsub(".y", "_2010", .x)) | |
| } | |
| #2010 and 2020 Census Data | |
| raw2010 <- pl_subset(pl_read(pl_url("MD", 2010)), sumlev="140") | |
| data2010 <- pl_select_standard(raw2010) | |
| vraw2020 <- pl_subset(pl_read(pl_url("MD", 2020)), sumlev="140") | |
| data2020 <- pl_select_standard(raw2020) | |
| va_merge <- merge(data2020, data2010, by="GEOID") | |
| merge_final <- renameColums(merge) | |
| merge_final <- mutate(merge_final, PopChange = pop_2020 - pop_2010) | |
| write.csv(va_merge_final, "md.csv") | |
| #Get Newest Census Tracts | |
| tracts_2020 <- tracts("MD", year=2020, progress_bar=FALSE, class="sp") | |
| writeOGR(va_tracts_2020, dsn = "md.shp", layer = "map", driver = "ESRI Shapefile" ) |
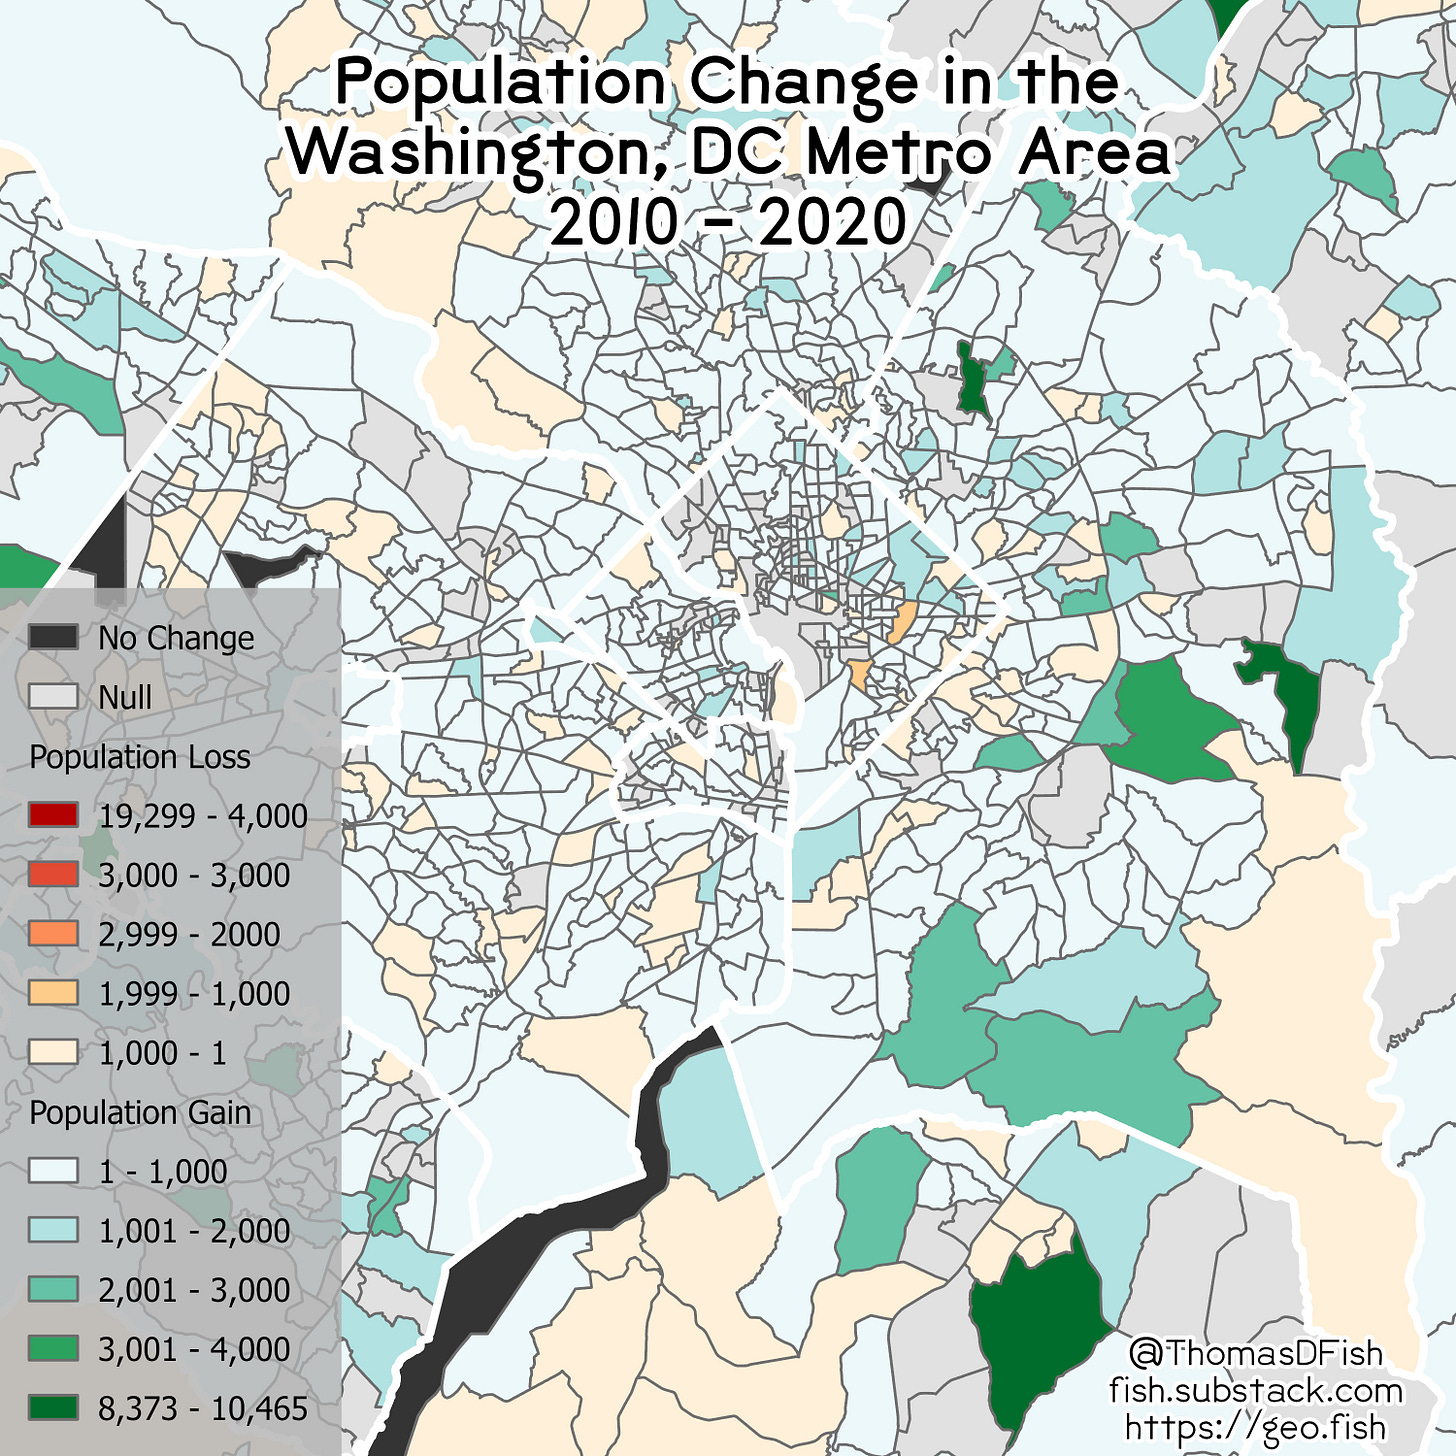
I move the shapefile and CSV into ArcGIS Pro and merged them together.2 Then I symbolized the data. The results can be seen in the map below. All of the middle gray areas are ones that have different boundaries compared to the 2010 census. Not great. I knew that the Census Bureau updates the boundaries of census blocks, tracts, and zip code tabulation areas with each census, but I thought that the census tracts would be more stable than this. This is normally because the density of the Block or Tract has changed enough that it makes sense to split the block in half.
From this patchwork of data, I can still see some trends. The outer suburbs of DC in Prince George’s County, Maryland and Charles County, Maryland are growing. DC and its inner suburbs are growing much slower than I would have expected due to the demand for housing. But, the amount of null values makes it hard to tell a story.
To fix this, I need to use a smaller unit from the previous census (block group or block) to calculate what the population was in each of these in 2010 to compare it to 2020. This is a long and painful process. Also, the full census data is being released on 30 September and I think that the Census Bureau is going to do this work for me. I am going to wait to see if I can get better numbers in a month and a half.
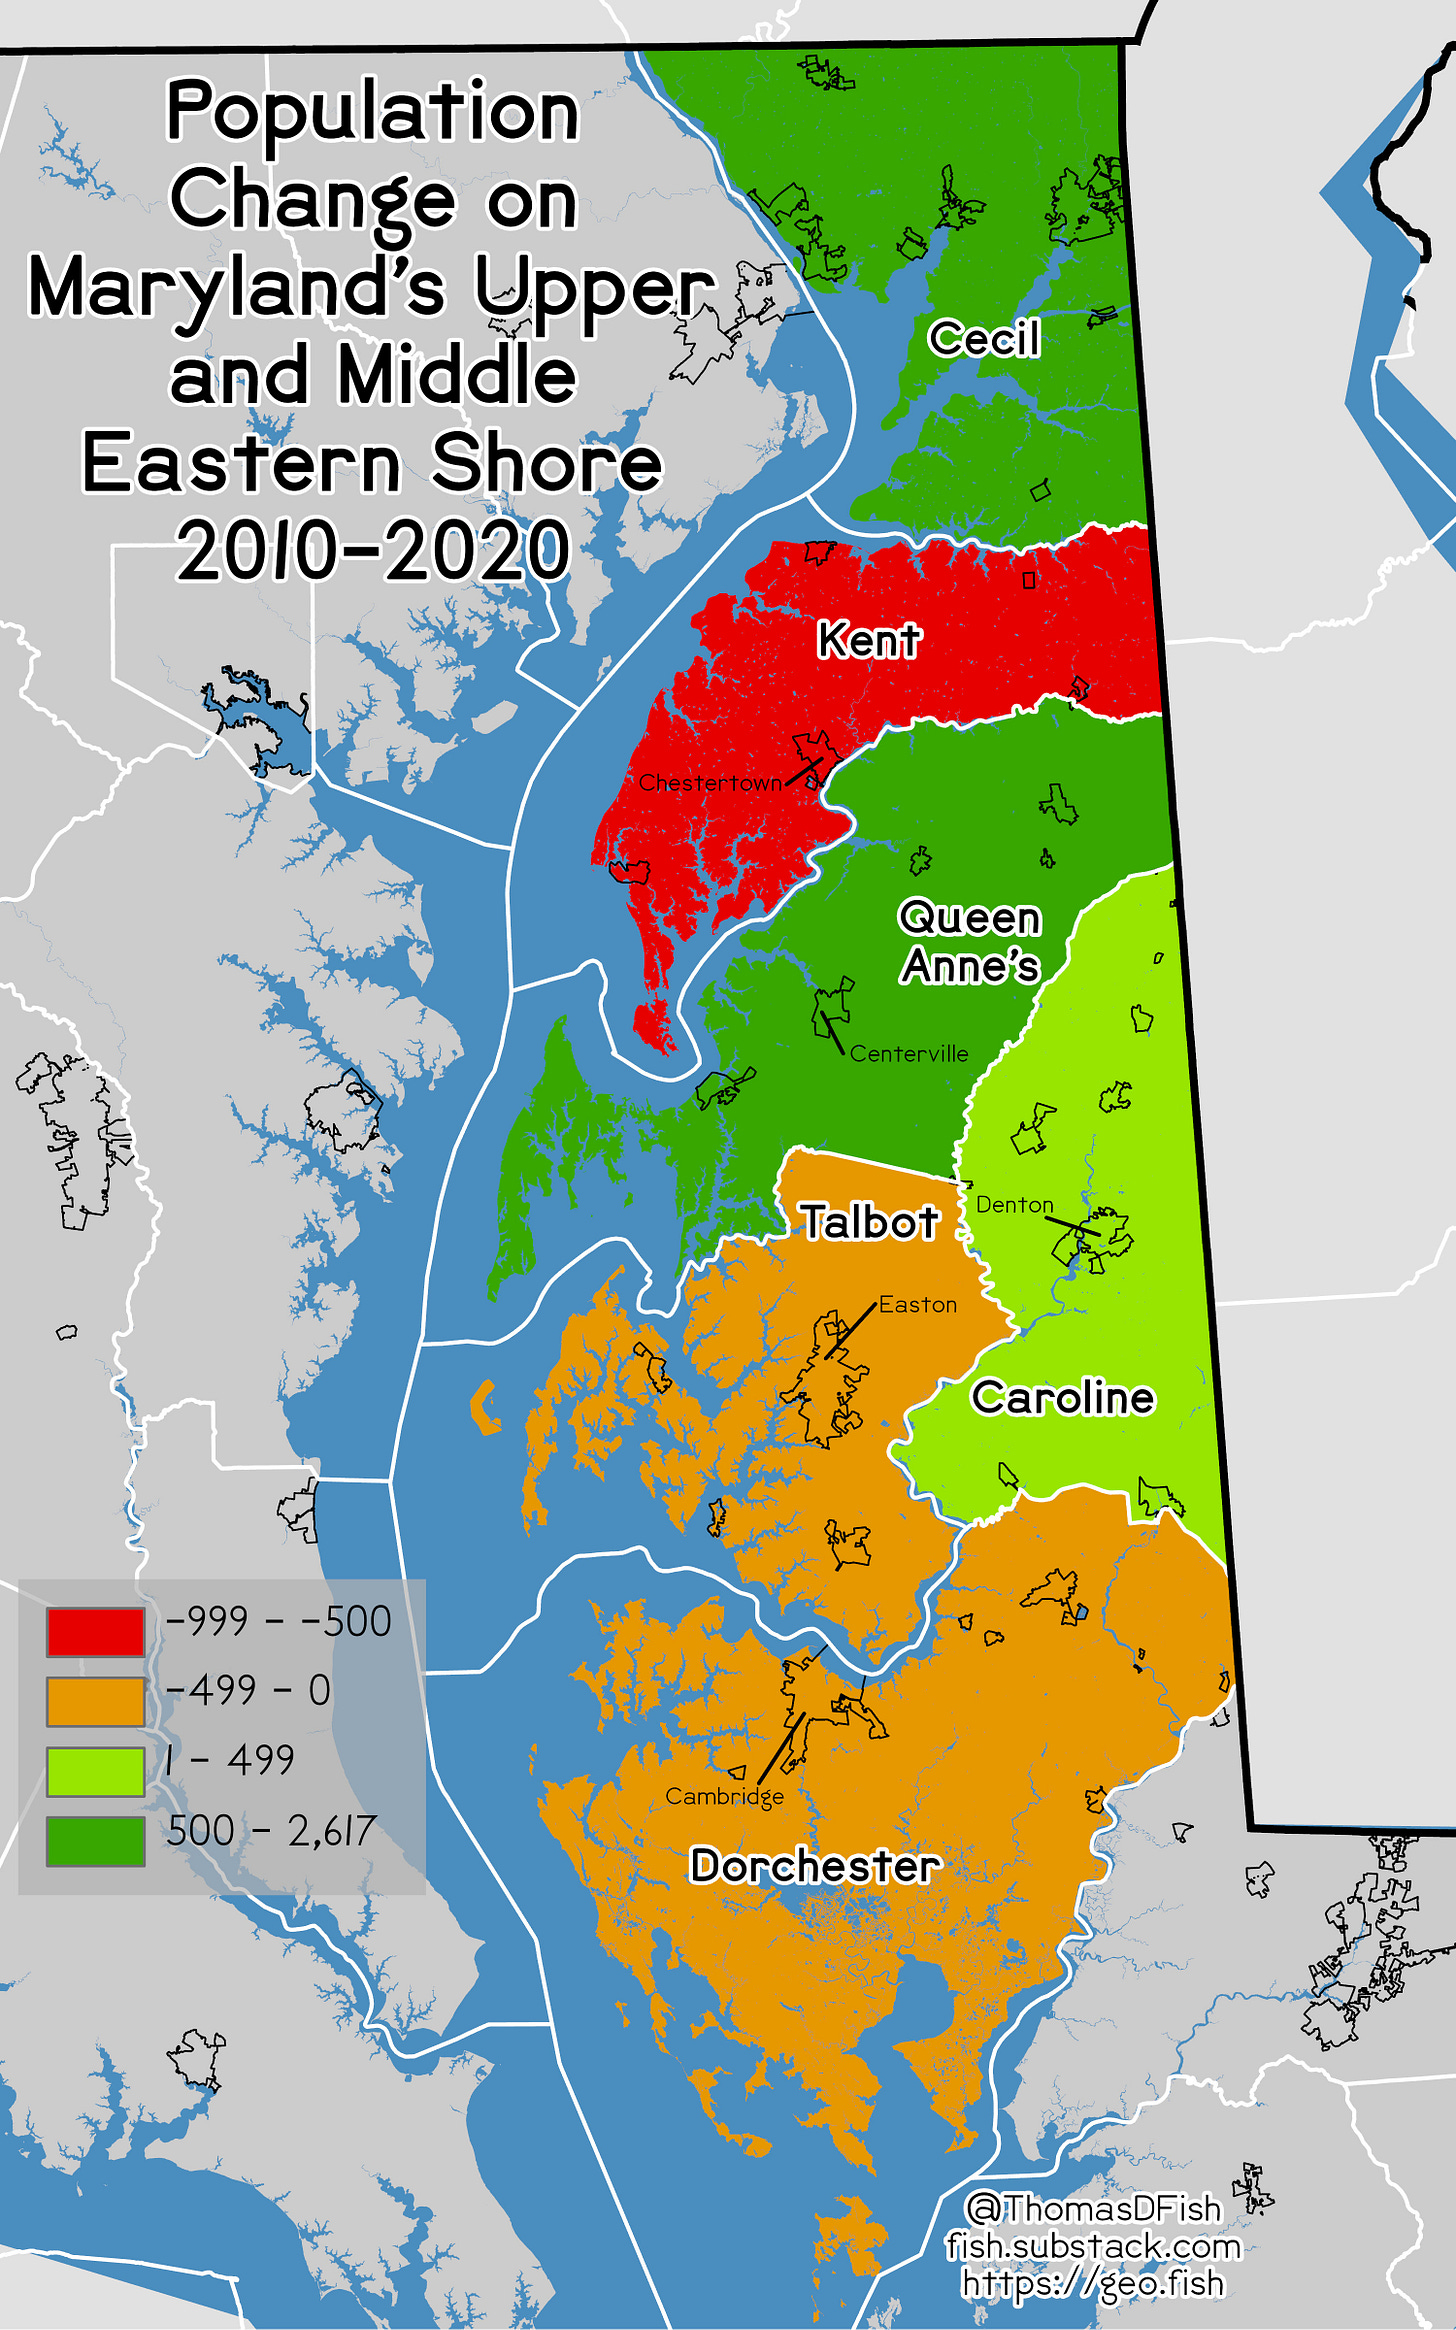
A place where this is less of a problem is the Upper and Middle Eastern Shore of Maryland. This area holds a special place in my heart because I went to college in Chestertown and then lived there for a year and a half after I finished my BA. It is mostly rural and there has been limited new housing built. This means that the census tracts are mostly stable except for three tracts in Cecil County. The raw population change at the census tract level can be seen in the map below.
While urban migrations have been a theme of the reporting on the 2020 census so far, something very similar is happening in rural areas. The parts of Cecil County that are growing are the outer suburbs of Baltimore, and can possibly be considered to be the outer suburbs of Philadelphia as well, are growing the most. The massive population growth on the peninsula-looking area of Queen Anne’s County is similar.3 That is where the Bay Bridge is. The growth is due to being a suburb of Annapolis.
The other areas that are growing are the major towns and cities of the Upper and Middle Eastern Shore. The only part of Kent County that is growing is the tract that contains most of Chestertown. Similar things can be said about Cambridge in Dorchester County, Centerville in Queen Anne’s County, and Easton in Talbot County. People are leaving the smallest towns on the Upper and Middle Eastern Shore but are moving to the larger towns and cities. Of note, the seaside towns of St Michael’s, Rock Hall, and Betterton have all lost over 300 residents.
Caroline County is the outlier here. Denton is the county seat and has seen growth comparable to Chestertown. But the very small towns of Federalsburg and Greensboro have seen the same amount of growth. I am very confused as to why these tracts have bucked the trend of the rest of the region. As seen in the map below, the whole county has grown. Weird.
Just replace MD in each place in the script with the two-letter postal abbreviation of whichever state you want to look at and it will output a shapefile and CSV for you.
The GEOID is text in the shapefile and a double in the CSV. I fixed this in ArcGIS Pro, but you can also do this in R.
Fun fact, it is actually an island


