Where in Washington, DC is it most Dangerous to Bike?
Mapping the places where cyclists were injured or killed
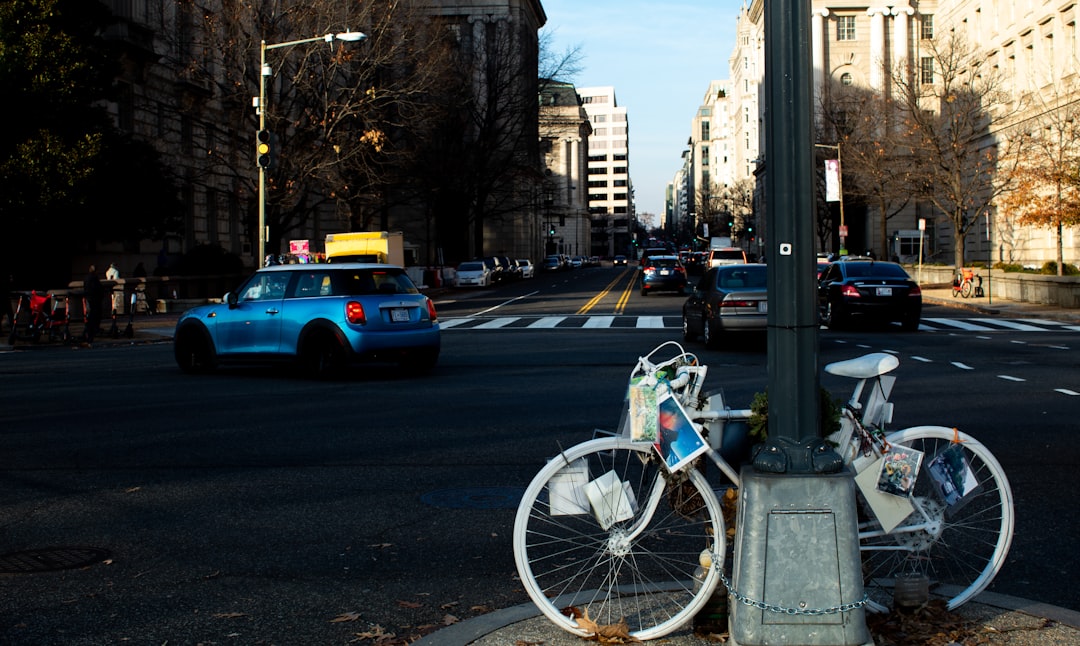
In the last few days, the BikeDC community placed three ghost bikes to commemorate the lives of three cyclists — Michael Hawkins Randall, Michael Gordon, and Shawn O’Donnell — who were killed while biking this month. When yet another cyclist is killed in DC, it reminds those of us who have biked in the city of our near misses, the areas of the district that we think are dangerous, and the cyclists whose deaths did nothing to change public policy. To me, it evokes memories of sharrows on far too busy streets, swerving to avoid Ubers and trucks who think bike lanes are their drop-off zones, etc.

Memories are good, but they are hard to extrapolate from. Having a near miss last month in a neighborhood may be a sign of the attitude people have to cyclists, but it also may just be a coincidence. Luckily, we have data to draw conclusions from. The Metropolitan Police Department and the DDOT Traffic Safety Division maintains a dataset of all crashes within their jurisdiction.1 It was last updated in December of 2021, and there are plenty of caveats, but it is a good jumping-off point.
Vehicle-bike collisions
First, I was interested to see the frequency and density of crashes2 involving at least one bicycle3 and automobile. To keep things reasonable, I decided to look at the last decade reported by DC, from 2011 to 2021. About 4,600 collisions of the type I am interested in were reported in the time frame. Since they are included in the database, they must be severe enough that MPD or DDOT was informed. I have no idea what proportion of crashes go unreported.
Looking at the dots, you can see a general picture of where collisions happen. However, the stacking of dots by ArcMap sometimes leads to poor conclusions. To figure out what areas of the city have the highest density of automobile-on-bike collisions, I ran the points through QGIS’s kernel density tool.4 The darker the red, the more crashes.
There are two main areas of high collisions: in Georgetown (ANC District 2E) along M St NW and a large zone up the center of the city from ANC District 1A to 2C. M St NW makes sense to me; it was never fun to bike. The Columbia Heights-U Street-Logan Circle area blew me away. One of my assumptions was that tourists were often getting into minor crashes. The zone goes far enough north that the burden has to be carried by Washingtonians. After living on the Maryland side of the DC line in Friendship Heights, I would have thought it would be worse off. Navy Yard is also much better than I expected based on my workout rides.
Serious crashes
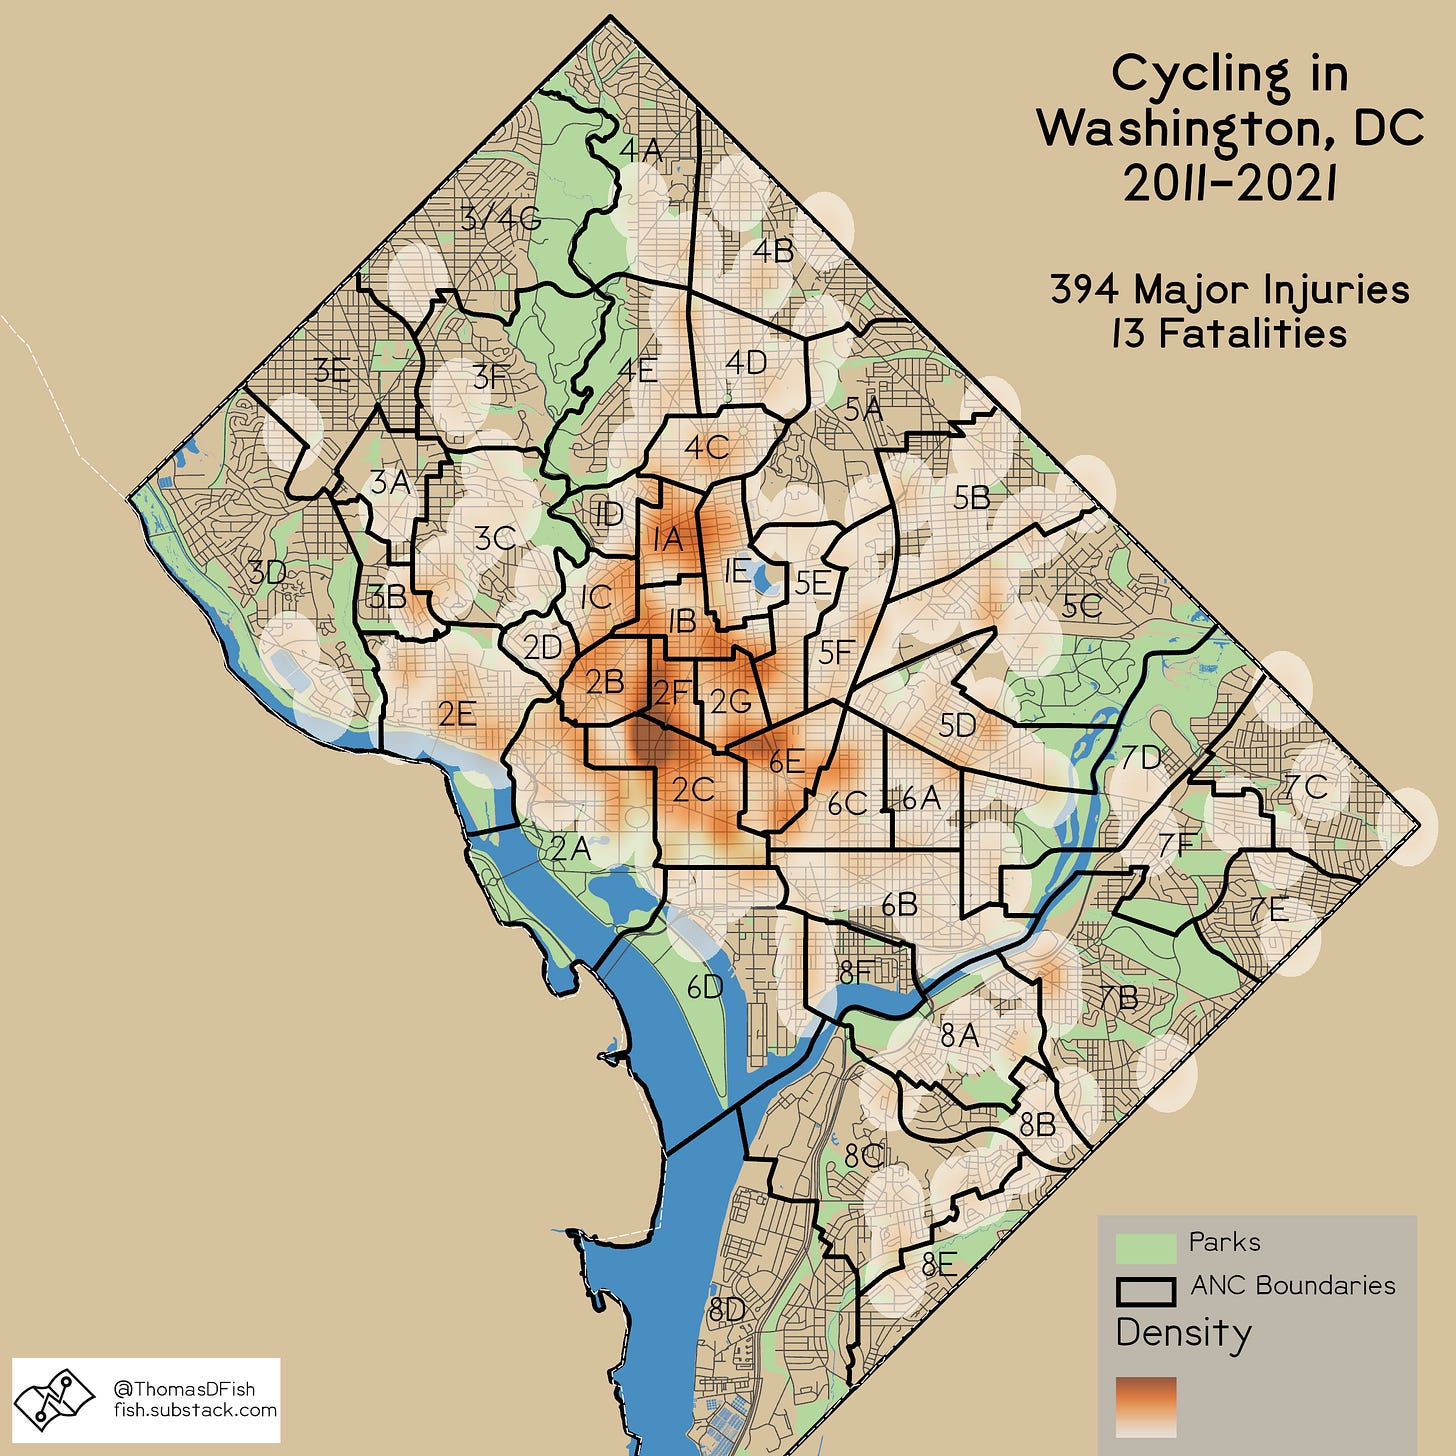
The dataset reports the injury severity of any cyclists involved. In the eyes of the Metropolitan Police Department and the DDOT Traffic Safety Division, 394 cyclists suffered significant injuries from a collision, while 13 died.5 I do not know how serious injuries need to be for them to qualify as major, so take this with a grain of salt. I was going to show only the fatal crashes, but I thought it was too rare of an event to extrapolate conclusions from.
The density of serious crashes follows the general contours of all crashes. However, this data shows a few definite “hot spots.” Where ANC Districts 2B, 2F, and 2C meet has the highest density of severe collisions of anywhere in the district. Additionally, where ANC Districts 2G and 6E meet has a high number of serious crashes as well as 1A.
I have no solutions, and I understand that this does not identify unsafe individual roads. Still, I hope this helps cyclists in DC better utilize their energy to advocate for improved bike infrastructure.
I officially have to state somewhere on this page that Washington, DC claims that the data is subject to copyright protection but has been released under the Creative Commons Attribution 4.0 International license. I think this is more a case of the district claiming copyright to everything they release even if it may actually be in the public domain.
While in common parlance we frequently use the term “accident,” it is loaded with value as to who is the most important person on the road and how much culpability each participant in a collision has.
Since scooters are not an option in the data, I assume all two-wheeled personal mobility devices without an engine are considered to be bikes
Pixels are about 11 meters, and the search radius is about 555 meters.
I do not know if fatalities includes people who died days or hours later from their injuries. I bring this up because 13 fatalities in 10 years seems low based on how often a ghost bike needs to be created.


